EPA Unified GIS Application Guide
User guide to the EPA Unified GIS Application
Environmental Protection Agency
User guide to the EPA Unified GIS Application
Environmental Protection Agency
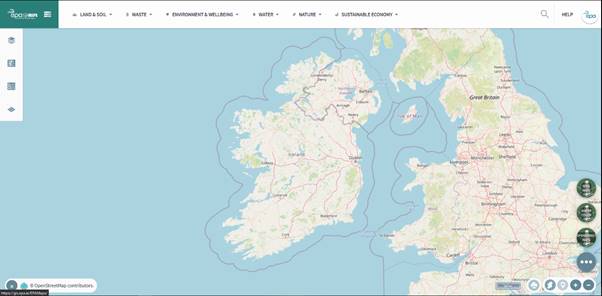
Figure 1: Opening View of EPA Unified GIS Application
The
EPA Unified GIS Application is a new framework for all our GIS. It offers the
possibility to select different configurations from one application. Currently,
there are the following configurations available;
·
EPA Maps
·
Environment & Wellbeing
·
Appropriate Assessment
·
Sewage Treatment
·
Water
·
Pollutant Release & Transfer Register
·
Strategic Environmental Assessment
In
time, all EPA GIS applications will be included. The application provides a
library of spatial data layers and a host of functionality, including the
following:
·
Spatial Data Layers
·
Search Tools
·
Identification of Features
·
Measurement and Graphic Tools
The
application can be accessed using the link: https://gis.epa.ie/EPAMaps/
The EPA Unified
GIS Application layout consists of a theme toolbar at the top of the
window, a side menu and navigation tools. The application currently holds
different configurations; EPA Maps, Environment & Wellbeing, Appropriate
Assessment, Sewage Treatment, SEA, PRTR & Water. Figure 2 below provides a
visual guide for the EPA Maps configuration and figure 3 provides a visual
guide for the Sewage Treatment configuration. Click on the application drop
down menu as shown in figure 2 to switch between the different configurations.
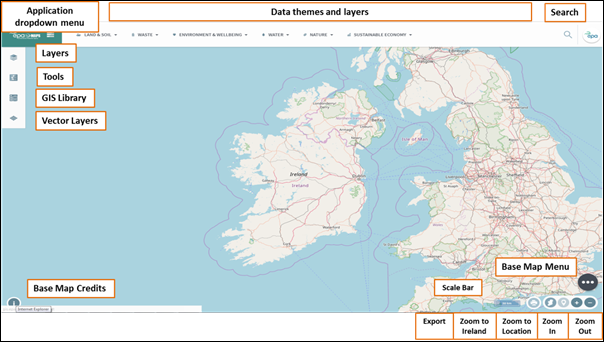
Figure 2: Overview of EPA Maps within EPA Unified GIS Application
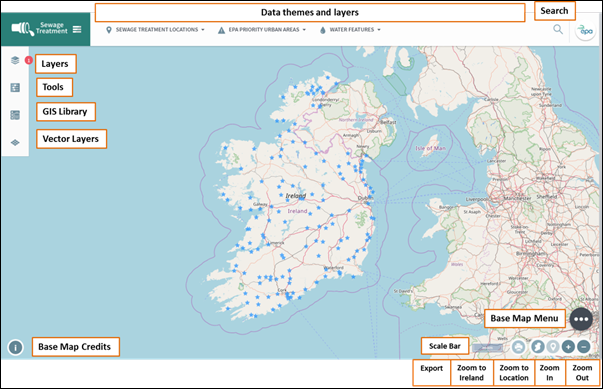
Figure 3: Overview of Sewage Treatment Configuration within EPA Unified GIS Application
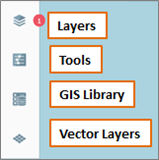 The
functionality of the four buttons on the left-hand side of the screen will be
described later on in this document. The links to these sections are below:
The
functionality of the four buttons on the left-hand side of the screen will be
described later on in this document. The links to these sections are below:
·
Tools
The navigation tools allow the user to zoom in or out,
move around the map or view the entire country. The navigation tools are
grouped together in the bottom right corner of the application (Figure 4) and
are always visible. The functionality of each navigation tool is described
below.
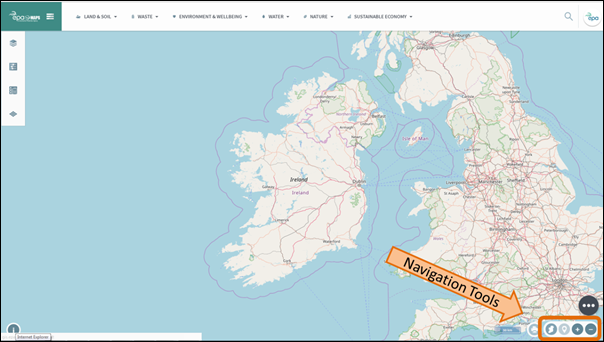
Figure 4: Location of Navigation Tools
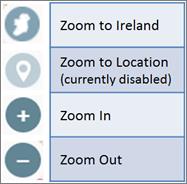 The
Zoom to Ireland button will change
to map view to be the full view of the Ireland (as shown in figure 3 above).
The
Zoom to Ireland button will change
to map view to be the full view of the Ireland (as shown in figure 3 above).
The Zoom to Location tool is
currently disabled. When it is enabled, it will zoom to the user’s current
location based on GPS.
Clicking on the Zoom In button will
zoom in on the map. This can also be done by wheeling the mouse wheel up or
double clicking on the map.
Clicking on the Zoom Out button will
zoom out on the map. This can also be done by wheeling the mouse wheel down.
The Export map
as image button is located in the bottom right corner of the application,
next to the navigation tools (Figure 5).
Arrange the map view as desired and click the Export map as image button. This will
automatically download the map as a .png image which
can be found in the Downloads folder (Figure 6).
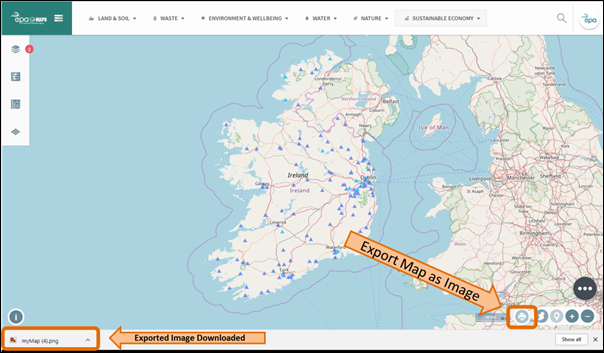
Figure 5: Location of 'Export map to image' button
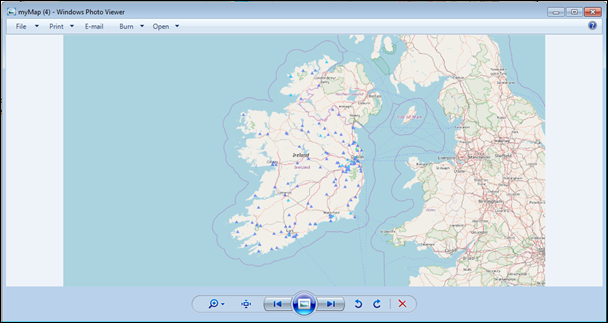
Figure 6: Export map to image example
The Base Map
Menu button is located on the right-hand side of the mapping application,
above the navigation tools (Figure 7). At the moment there are three base map
options: OpenStreetMap, Bing Maps and Water Colour. These options can be
selected by hovering over the Base Map
Menu button as shown in figure 7 and clicking the base map of your choice.
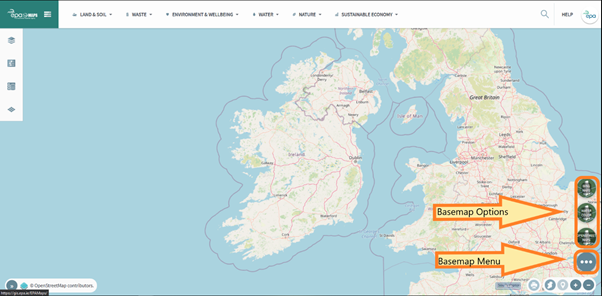
Figure 7: Location of Base Map Menu button
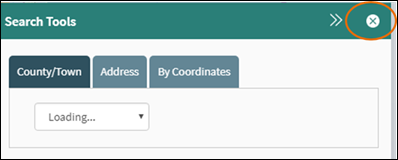
The Search
Tools provide the option to search by County/Town,
Address or a set of Coordinates. Click the Magnifier icon in the theme tool bar to
open the Search Tools (Figure 8).
![]()
Figure 8: Accessing Search Tools from Theme Toolbar
In the Address
tab of the Search Tool (Figure 9),
begin typing the address you are interested in into the search box and a
selection of results will begin pop up. Click on the appropriate result and the
map will zoom to that location. You may also search by Eircode.
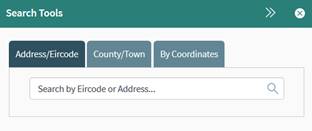
Figure 9: Searching by Address
In the County/Town tab of the Search Tool (Figure 10), search for a County by making a selection from the
first drop down menu and the map will zoom to that county. Search for a town by first selecting a county and
then selecting a town from the drop-down menu. The map will zoom to the centre
of that town.
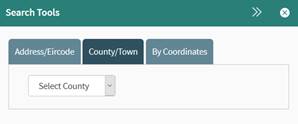
Figure 10: Searching for County/Town
In the By Coordinates tab of the Search tool, the user can search for a
location by entering a set of coordinates in WGS84, Irish National Grid or
Irish Transverse Mercator (Figure 11).
Once you have chosen your coordinate reference system, enter the
Easting/Northing or Latitude/Longitude coordinates and click Find Location. The map will zoom to the
coordinate’s point location and a marker will appear on the map provided that
the coordinates entered are valid.
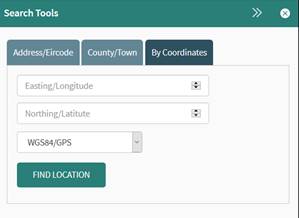
Figure 10: Searching by Coordinates
This section explains how to:
·
Access and display data on the map
·
Access the legend for this data
·
Use the query/filter tool
·
Order layers
·
Identify features
There are two ways to access spatial data layers in
the Sewage Treatment Application:
A)
From the top Theme Toolbar
B)
From the GIS Library
To access layers from the Theme tool bar, hover over a theme e.g. Sewage Treatment Locations (Figure 12).
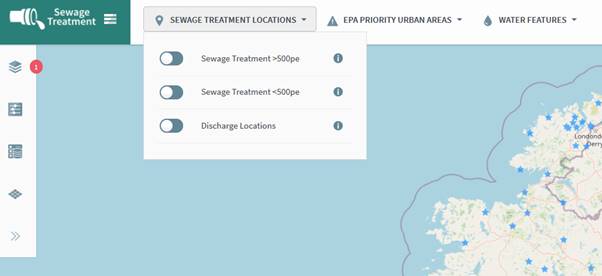
Figure 11: Hovering over Theme Toolbar
Then click on one of the layers within the theme to
turn it on, e.g. Sewage Treatment
>500. The slider will turn green (Figure 13).
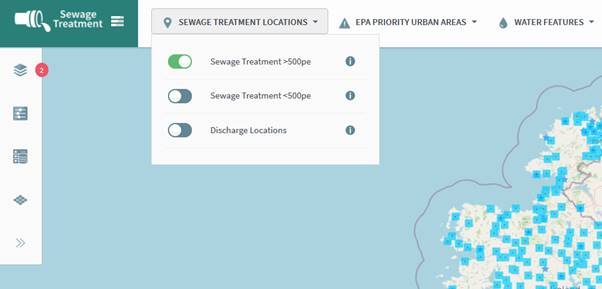
Figure 12: Turning on layer from Theme Toolbar
![]() The
dataset will appear on the map. Notice how the Active Layers tab now has an icon with the number beside it, this
means that there is one active layer on the map.
The
dataset will appear on the map. Notice how the Active Layers tab now has an icon with the number beside it, this
means that there is one active layer on the map.
If you wish to turn the layer off and remove it from Active Layers, click the slider button
again.

The Theme
Toolbar is designed to give access to the layers of most relevance to the
current configuration of the application. Additional data layers that are not
available in the Theme Toolbar can
be accessed via the WMS Layers
(Figure 14). This tool allows you to search for all GIS layers in the system,
currently there are >300 layers of data. Clicking this button will open up a
search box.
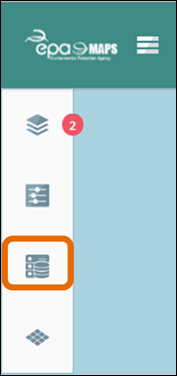
Figure 13: WMS Layers
Type the name of the layer you’re interested in into
the search box to begin searching for the dataset. The library will filter to
show relevant datasets. Turn on a dataset by clicking the slider button (Figure
15). The layer will then appear in the Active
Layers tab.
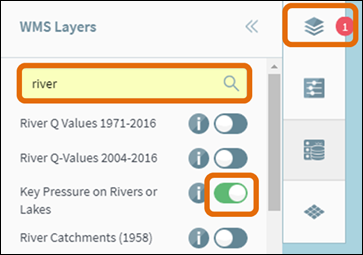
Figure 14: WMS Layers Search Tool
Vector tile layers can be accessed as shown in figure 16.
Currently, there are only two layers available in the Vector Layers; EPA
Offices and Counties, but we are working to extend this functionality to all
data layers.
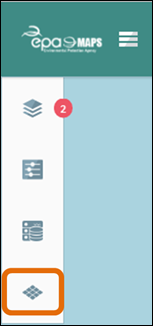
Figure
15:
Vector Layers
The Vector Layers provide information for a feature by hovering over
the feature on the map with the mouse cursor (Figure 17).
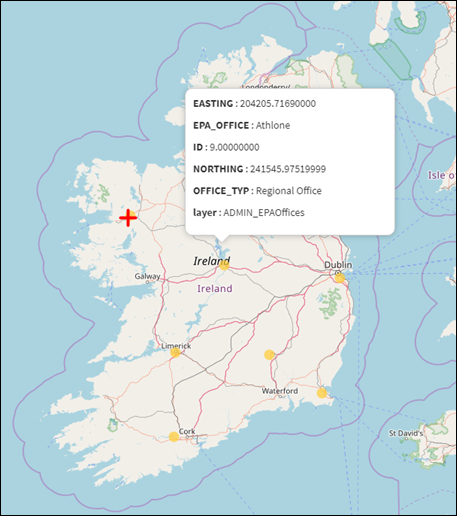
Figure 16: Vector Layer Feature
Details
To access
the metadata for a dataset, click on the Information
icon as shown in figure 18. This will open a new window containing a metadata
abstract. A link to the full metadata
can be found at the end of the pop up window. Clicking this link will open the
full metadata in the EPA Metadata
Catalog in a new tab of your browser.
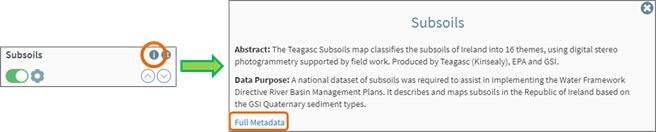
Figure 17: Accessing Layer Metadata
If you do not see any data on the map after turning on
a layer, then the layer has a scale dependency applied. The on/off switch for
these layers will appear greyed out in the Active
Layers list. To view the data, you must zoom in or out to a different scale
(Figure 19).
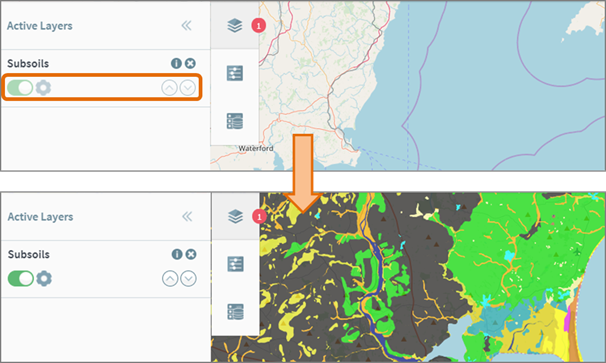
Figure 18: Changing Scale to Turn on Certain Layers
The Active Layers tab provides a single area to view and control the
layers.
The legend can be accessed by clicking the Show Advanced Layer Setting, as shown
in figure 20. The legend will be displayed under the legend heading. This
provides a description for the data on the map.
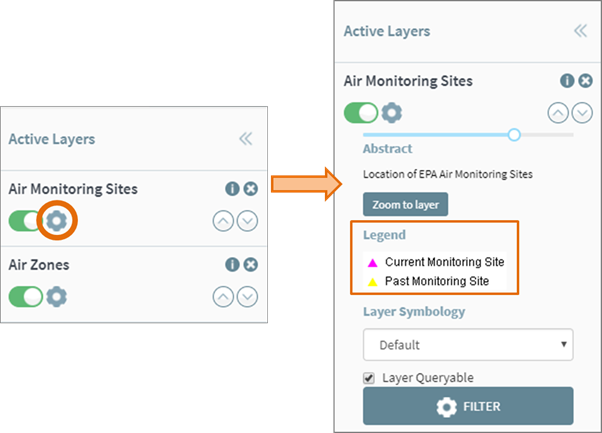
Figure 19: Showing 'Advanced Layer Settings' and Layer Legend
The Filter tool
can be used to show a subset of a dataset’s features on the map. Make sure
the layer you wish to filter is present in the Active Layers window. Select the Show Advanced Layer Settings cog for that layer (Figure 20).
Click the Filter
icon in the Active Layers window
(Figure 21).
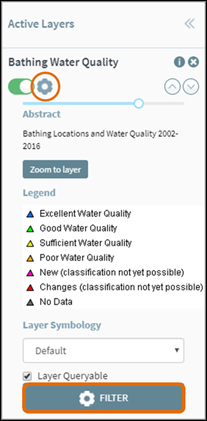
Figure 20: Filter Tool
Next, click the Select
Attribute drop-down (Figure 22). Specify the attribute you wish to perform
the query on. In this example we are interested in the current classification of each location so we will choose ‘currentclassification’ from the Select Attribute drop-down (Figure 22). We require ‘Excellent
Waters’ so we can select Like from Select Operator drop-down (Figure 22).
Next, we can type “Excellent” or more specifically “Excellent Water Quality” in
the Search box (Figure 22).
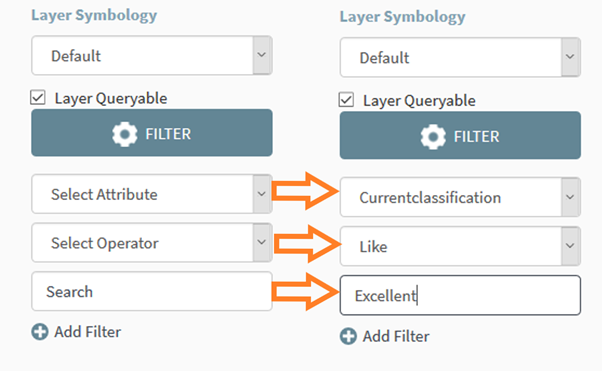
Figure 21: Filter Parameters
Click the Add
Filter icon (Figure 23). Note that the text must be entered correctly
(spelling, spaces and upper or lower case, as shown in the Layer Legend).
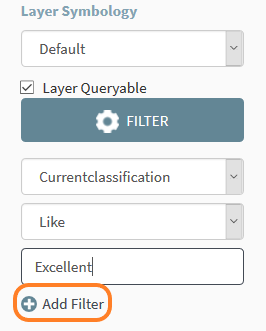
Figure 22: Add Filter
The filtered data will be
displayed on the map. To remove this filter, click the Remove Filter icon shown in figure 24.
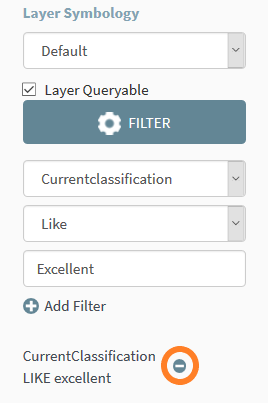
Figure 23: Remove Filter
The Filter
tool can be used to search for a particular record within a dataset. In the
following example we will use the Filter
tool to find a specific waste facility. From Select Attribute drop down select the attribute you are interested
in, e.g. Regcd. For Select Operator we can specify Like.
In the search box we can type “W0070” for example. Next, click Add Filter as shown in figure 25. Only
the facility W0070 will be shown on the map for this layer.
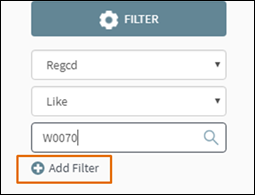
Figure
24: Add
Filter for Query
It is possible to update the layer symbology for some layers in the
application. Note that this is not yet available for many layers, but work is
currently underway to extend this functionality to more layers.
Default symbology is
currently configured within the Active
Layers under Layer Symbology (Figure
26).
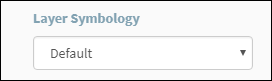
Figure 25: Default Layer Symbology
Click the Layer Symbology
drop down to see what other symbology is available. Special Areas of
Conservation (SAC) for example currently has alternative symbology available
that can be chosen (Figure 27).
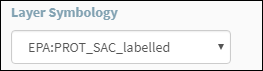
Figure 26: Alternative Symbology
In
the Active Layers window, it is
possible reorder how the layers are shown the map.
Click the
up/down icon beside a layer to move it up or down the list in Active Layers
(Figure 28).
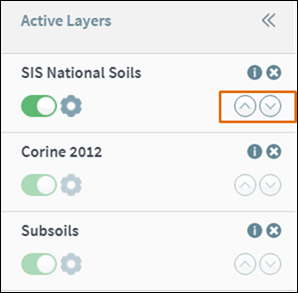
Figure 27: Reorder Layers in Active Layers window
If you
want to keep a layer in your list but wish to turn it off momentarily, simply
click the on/off icon (Figure 29).

Figure 28: Turn On/Off Layer
If you wish to remove a layer from Active Layers click the Remove Layer button (Figure 30).

Figure 29: Remove Layer from Active Layers
Layer
Transparency allows the features beneath a dataset to become
visible, while allowing partially transparent features to be visible also.
There is a transparency slider within the Advanced
Layer Settings for each layer in the Active
Layers window (Figure 31).
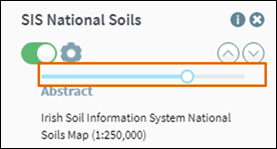
Figure 30: Transparency Slider for Active Layers
It is possible to identify information about
individual features from the Active
Layers visible on the map.
Simply click on a feature on the map and the Results window will open with the
returned feature. Click the Show/Hide
Details icon to expand the result and find more information about the
record (Figure 32).
Click the Pin
icon to zoom to a selected feature. ![]()
Remove a feature using the Bin icon. ![]()
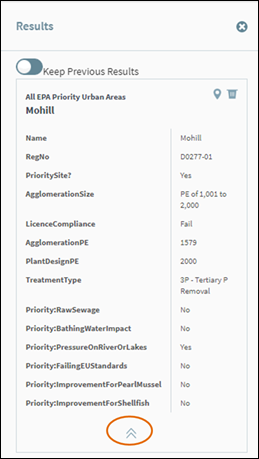
Figure 31: Show/Hide Feature Details
If you wish to identify any more than one feature,
ensure the Keep Previous Results is
switched on (Figure 33).
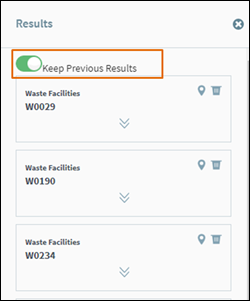
Figure 32: Identifying Multiple Features
Scroll to the end of the Results window, and click the Export
icon. ![]()
This will download a comma-separated values (.csv)
file containing the features shown in the Results
window, which can be opened in Excel.
Please note a separate CSV is generated for the
features in each layer (Figure 34).
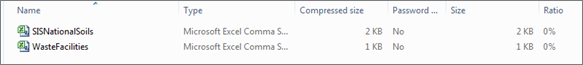
Figure 33: Export results
To delete
all results and close the results window, click the Clear All Results icon as shown in figure 35.
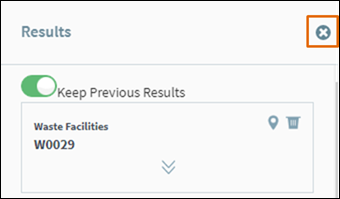
Figure 34: Remove feature from results
The Tools are accessed from the side menu
as highlighted in figure 36. The Search
Tools, Measurement Tools and Graphic Tools are the Standard tools
and are always available in the application regardless of which configuration you
have selected. Other tools are only available in certain configurations. The
standard tools are outlined in detail below;
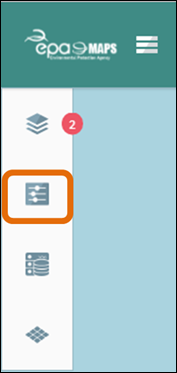
Figure 35: Tools access from side menu
Each tool has an option to minimise the tool after it
has been opened (Figure 37) or close the tool (Figure 38).
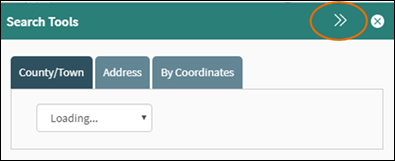
Figure 36: Minimize Tool
Figure 37: Close Tool
To access the Search Tools, click Tools and then Search Tools as shown in figure 39.
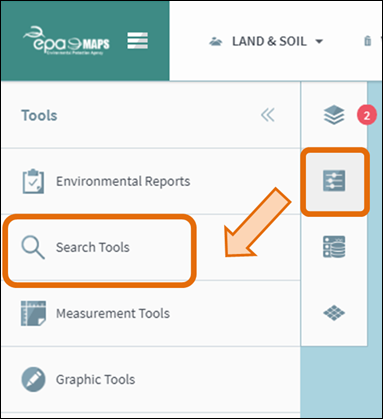
Figure 38: Search Tools
For a guide on how to use each of the search tools
please refer to the following sections of this document;
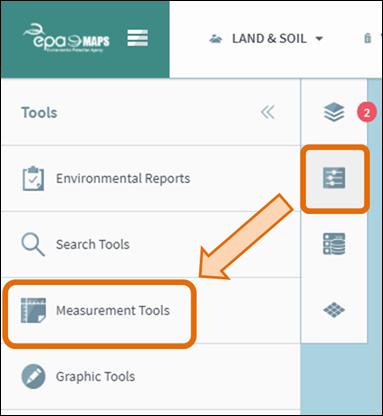
The application contains Measurement Tools which provide options for measuring Line distances, shape areas and the functionality to retrieve coordinates from the map.
To open the Measurement
Tools, click Tools and then Measurement Tools (Figure 40).
To measure distance on the map, open the Measurement Tools and click Measure Distance within the Measurement Tools (Figure 41).
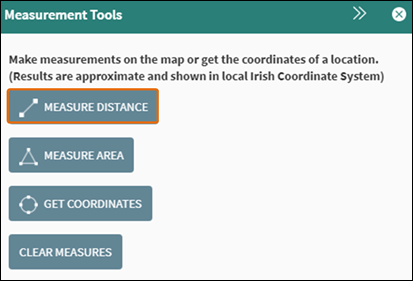
Figure 39: Measure Distance Tool
Next, click the map where you wish to begin measuring.
Click once on the map to change direction. Double click to define the end
location for the distance.
A line will appear on the map with the distance shown
in meters/kms (Figure 42).
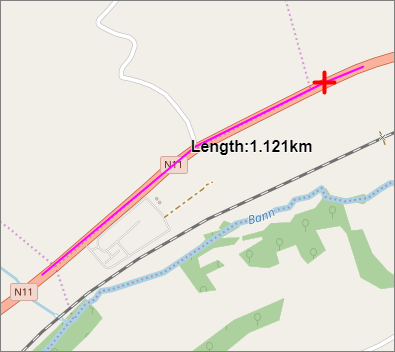
Figure 40: Measure Distance Example
To measure an area on the map, open the Measurement Tools and click Measure Area within the Measurement Tools (Figure 43).
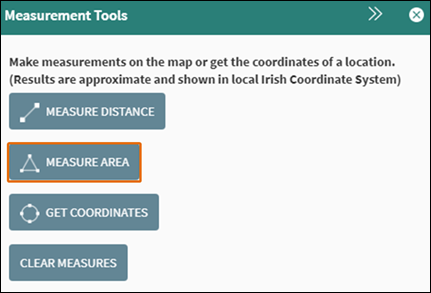
Figure 41: Measure Area Tool
Next, click the map where you wish to begin measuring.
Click a number of points on the map to draw an area, followed by a double click
on the last point to finish measuring the area.
A shape will appear on the map with the area shown in
m2/km2 (Figure 44).
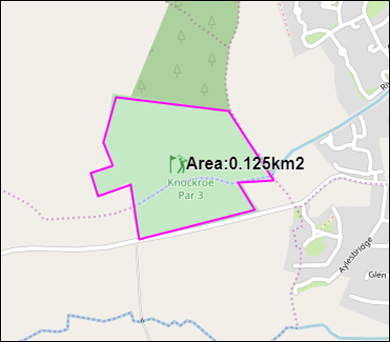
Figure 42: Measure Area Example
To get a set of coordinates for a location on the map,
open the Measurement Tools and click
Get Coordinates within the Measurement Tools (Figure 45).
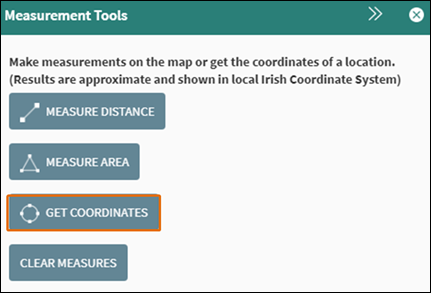
Figure 43: Get Coordinates Tool
Next, click on a point on the map you wish to get the
coordinates for.
The results will appear in the Measurement Tools window (Figure 46) in the following formats:
·
Irish
National Grid (Easting, Northing)
·
Irish
Transverse Mercator (ITM Easting, ITM Northing)
·
WGS84
(Latitude, Longitude)
·
Web
Mercator (Easting, Northing)
There is also a new URL which will can be copied and
used to open a new map and zoom to this point, there is an option to copy the
URL to the clipboard for later use. For an example, use the following URL to
zoom directly to a previous search result, https://gis.epa.ie/EPAMaps/default?easting=-723779.83&northing=6853757.19.
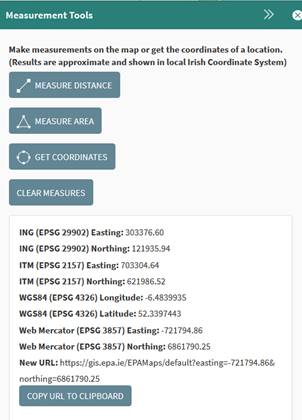
Figure 44: Get Coordinates Tool
Example
To clear the measurements, you have placed on the map,
click the Clear Measures Tool within
the Measurement Tools (Figure 47).
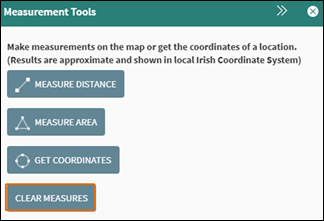
Figure
45:
Clear Measures
Once the
clear measurements button is pressed a blue pop-up will display in the top
right corner of the screen to say this has happened. Then just select the next
desired tool.
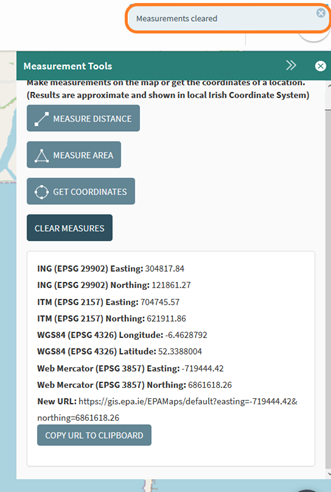
Figure
48: Clear Measures
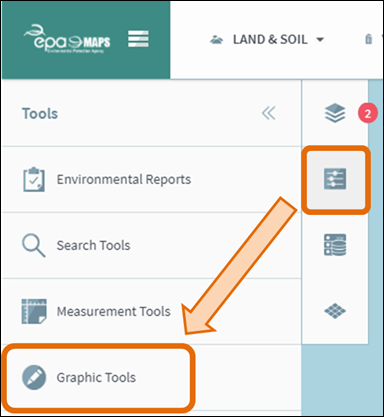
The Graphic
Tools provide the option to add various shapes to the map as graphics. Graphic
tools can be useful for highlighting certain features of interest.
Click Tools
and then click Graphic Tools (Figure
49).
To add a circle
graphic on the map, first choose the Line Colour and Fill Colour
for the circle, and then click on Circle
within the Graphic Tools (Figure
50).
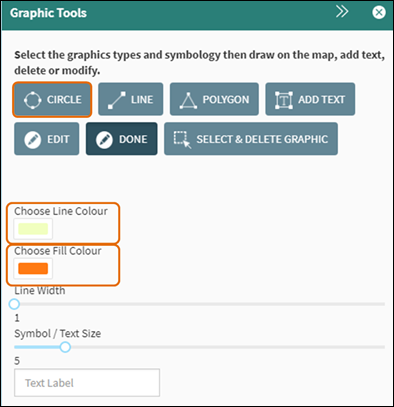
Figure 50: Add Circle Graphic
Next, click on the map where you wish to place the
centre of the circle and scroll the mouse inwards to increase the size of the
circle or outwards to decrease the size of the circle. A left click will finish
the circle (Figure 51).
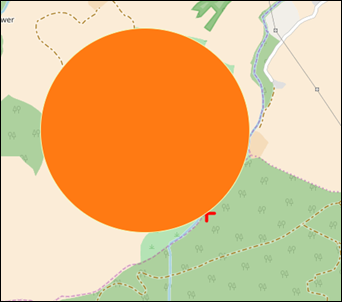
Figure 51: Example of Circle Graphic on Map
To draw a line on the map, first
choose the Line Colour and Line Width and then click on Line within the Graphic Tools (Figure 52).
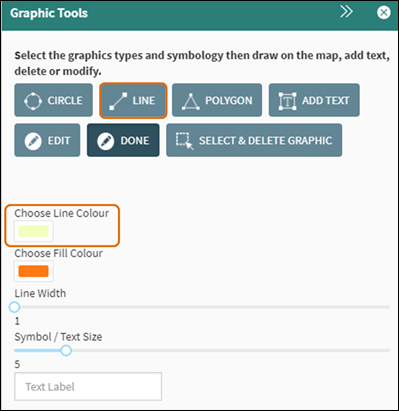
Figure 52: Line Graphic Tool
Next, click on the map where you wish to place the
start of the line. Click once to change direction. Double click to finish
drawing the line (Figure 53).
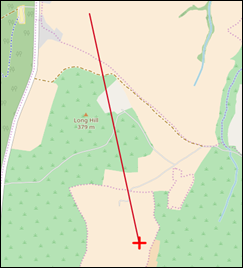
Figure 53: Line Graphic Example
To draw a polygon on the map, first
choose the Line Colour and Fill Colour and then click on Polygon within the Graphic Tools (Figure 54).
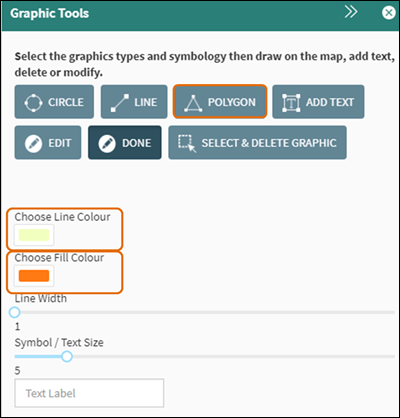
Figure 464: Polygon Graphic Tool
Next, click on the map where you wish to start drawing
the polygon and continue to click points on the map to create the polygon.
Double click to finish drawing the line (Figure 55).
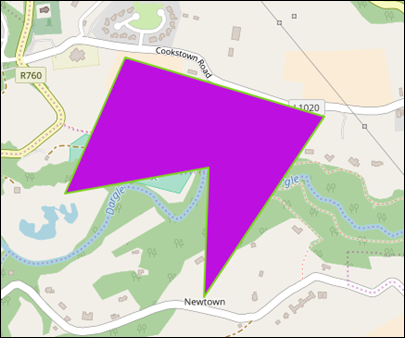
Figure 55: Polygon Graphic Example
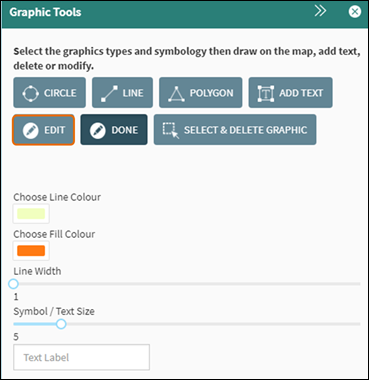
To add text to the map, first choose the Text Size and Line Colour, and then enter the text into the Text Label box (Figure 56).
Click Add Text.
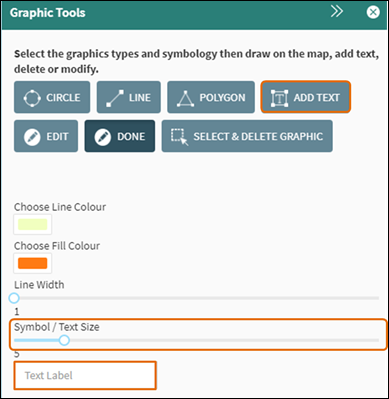
Figure 56: Add Text Tool
Click on a point on the map to add the text to that location (Figure 57).
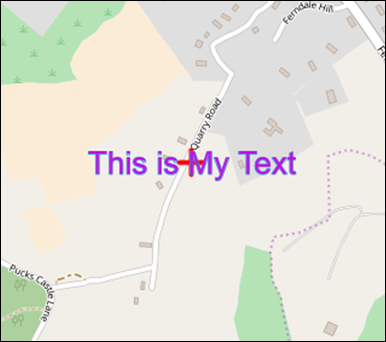
Figure 57: Add Text Example
The edit graphic tool provides the option to go back
and edit an existing graphic on the map.
Click on the Edit
button and click on a graphic on the map (Figure 58).
Figure
58: Edit Graphic Tool
The select and
delete graphic tool provides the option to delete a graphic from the map.
Click on the Select
& Delete button and click on a graphic on the map (Figure 59). You will
be prompted to confirm that you wish to delete the graphic you selected. Click OK.
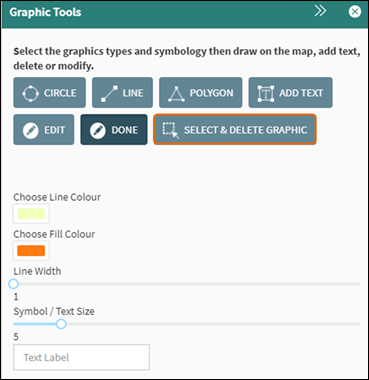
Figure 59: Select & Delete Graphic Tool
Within the Water section there are two specific functions, the Search Water Feature and the Hydro Tool.
It is possible to search by water feature, if you go to the water tab and then select ’Search Water Feature’ the panel on the right-hand side opens (figure 60).
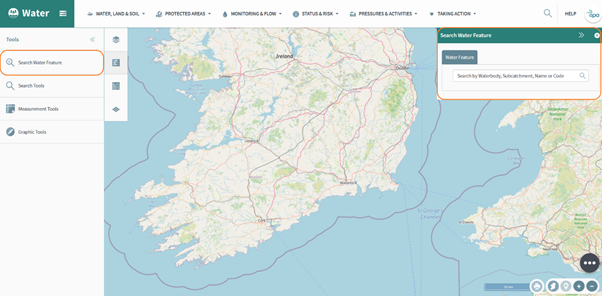
Figure 60: Water search feature
This tool allows the user to search by Waterbody, Subcatchment, Name or Code. Just use the top right-hand corner to input the details and the map will highlight the area as shown in figure 61.
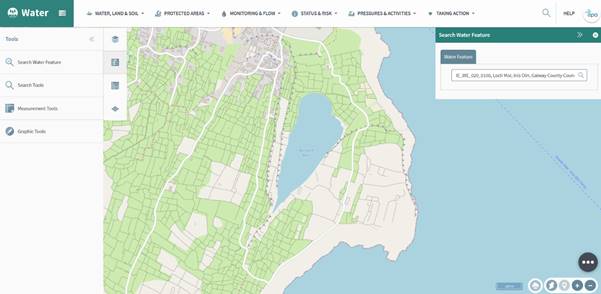
Figure 61: Water feature search results
The Hydro Link tool allows you to search which Water Catchment provides the flow for a selected Water Feature. To begin, open the ‘Monitoring & Flow’ tab and select the ‘Flow and Levels’ option (figure 62).
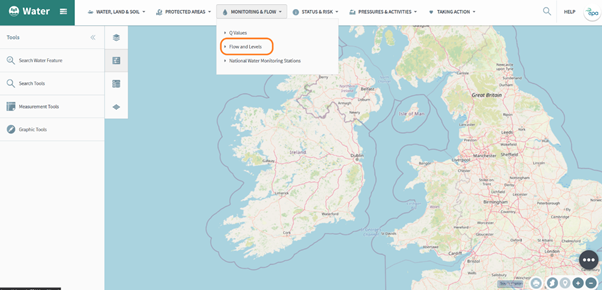
Figure 62: Hydro Link Tool
Next, turn on the ‘River Flow Estimates - Hydrotool’ and ‘HYDRO Catchments’ layers as shown in Figure 63.
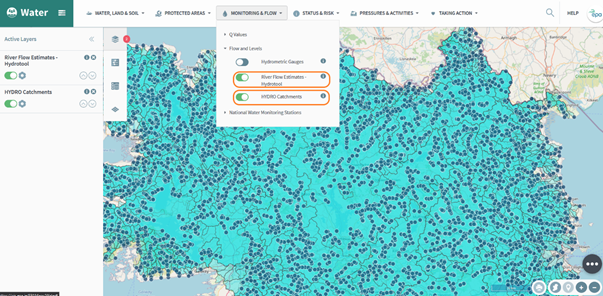
Figure 63: Hydro Link Tool
There is a lot of data on the screen and it can take a moment to load when zooming in or out. Zoom [TK(2] to a level where you can see the individual water features and select the one that you are interested in (figure 64). Due to the nature of the data it is possible to zoom to far and this will remove the data from the map. If this happens zoom out at small increments until it appears and then continue.
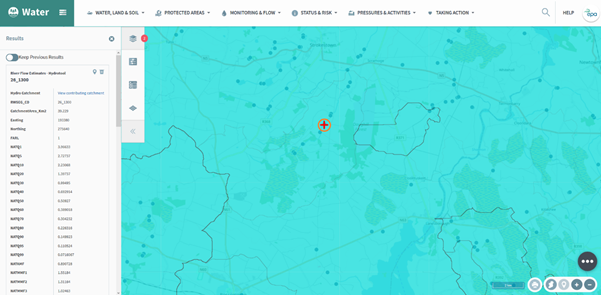
Figure 64: Hydro Link Tool
Figure 65 shows the results panel on the left of the screen. There is lots of detail available [TK(3] on this screen. For more information regarding this please look at the following links;
http://www.epa.ie/pubs/reports/water/flows/riverflowestimateshydrotool-readme.html
http://www.epa.ie/pubs/reports/water/flows/estimatedfdcandmeanflowforungaugedcatchments.html

Figure 65: Hydro Link Tool
By selecting the ‘View contributing catchment’ link on figure 65 the tool removes all of the catchments except the one directly contributing to the point that was selected (figure 66).
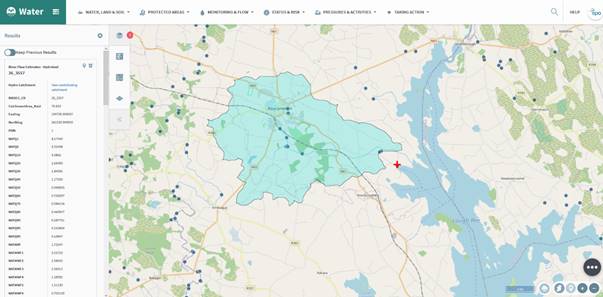
Figure 66: Hydro Link Tool
Figure 67 shows the full panel of results and these can be exported as a .csv as explained in the previous sections.
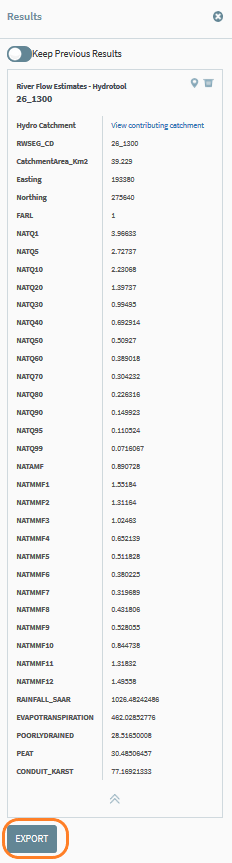
Figure 67: Hydro Link Tool results
When the PRTR tab is selected figure 68 opens, on this screen it is possible to see the search bar, the different layers open by PRTR Sector (PRTR: Energy Sector, PRTR: Mineral Industry) and the same options that are available in the other layers.
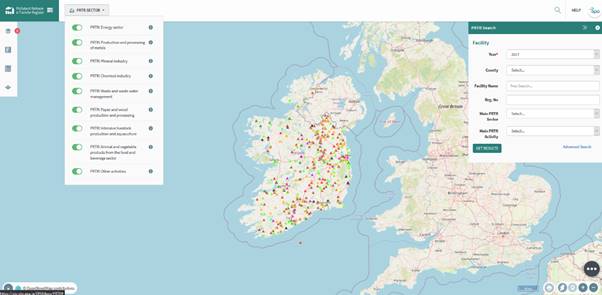
Figure 68: PRTR Home
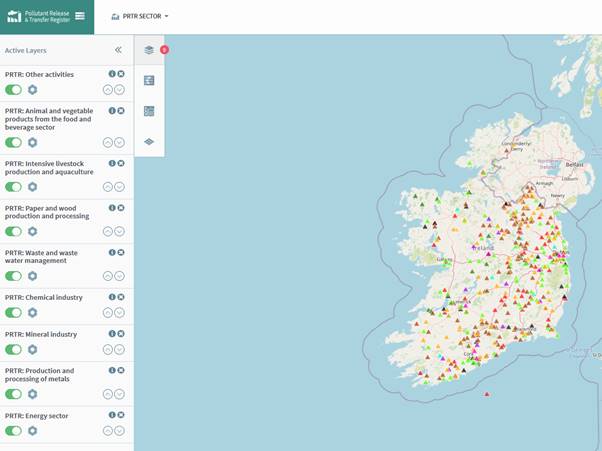
Figure 69: PRTR Layers
The layers can be toggled on or off using the active layers tab or the PRTR Sector drop down menu. The same tools are accessible on this page as described in the previous sections. There are several additions to this section which are described in the following sections.
Figure 70 shows the PRTR specific help screen, this is accessed by using the tools button and selecting the PRTR option, a panel on the right of the screen opens to give further information.
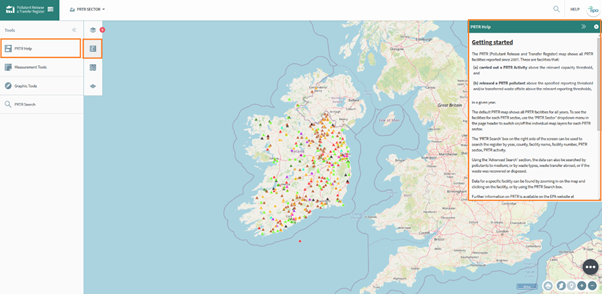
Figure 70: PRTR Help
To close this panel just select another option from the tools panel on the left.
A specifically designed search tool has been introduced for the PRTR data help on the site and can be accessed using the panel on the right of the screen, if it does not appear it can be selected from the tools tab on the left of the screen.
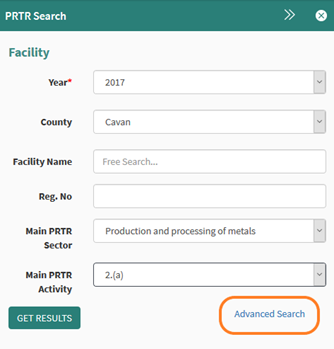
Figure 71: PRTR Search
Figure 71 shows the standard search options which are;
· Year – select from current or historical data
· County – chose any of the counties in Ireland
· Facility name – Search a specific facility name
· Reg. No – Search using Reg. No
· Main PRTR Sector – Use different sectors to search for facilities
· Main PRTR Activity – Use different activities to search for facilities
By using the highlighted advanced search in Figure 71, the advanced options are opened. Figure 72 shows the additional search fields.
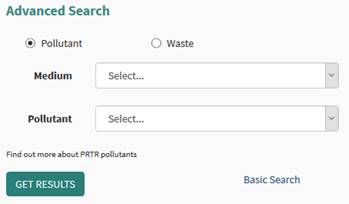
Figure 72: PRTR Advanced Search
Once the search parameters are entered, press the ‘GET RESULTS’ button. Figure 73 shows how the results are displayed in the panel on the left of the screen.
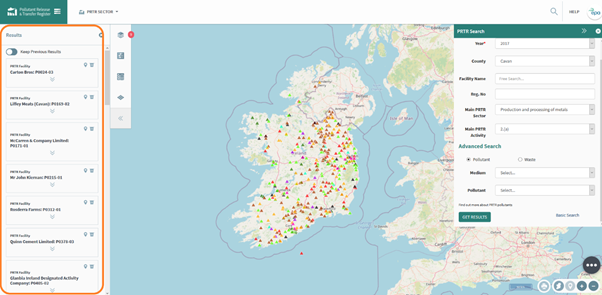
Figure 73: PRTR Search Results

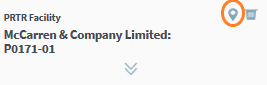
To remove this company use the trash button highlighted and to highlight the company on the map use the pin.

To look at more data press the two arrows highlighted which will expand the company of interest.
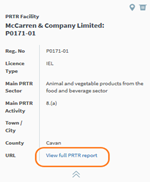
Figure 74: PRTR Facility Example
On the expanded section there is a link to connect full PRTR report which has a large amount of data on individual companies.
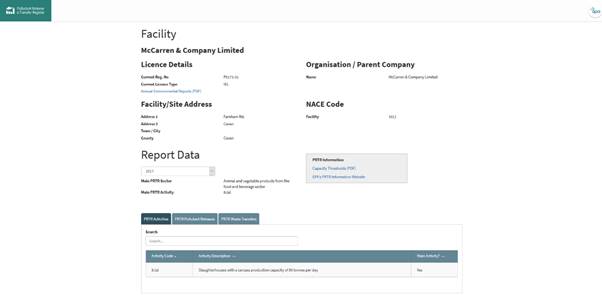
Figure75: PRTR Report Example
The PRTR report is shown in figure 75, there is a large amount of functionality including links to the Annual Environmental Reports and the EPA’s PRTR guidance website where more details can be obtained.
The Strategic Environmental Assessment GIS Reporting Tool (SEA Tool) functionality allows users to run reports by letting the user define a search area or select a pre-defined area. It is also possible to add a buffer around the chosen area. The report is published as a PDF. The reports are generated dynamically and will show the most recent available data for the various GIS layers used.
Note 1: Significant Water Framework Directive pressures relevant to the search area are included in the report tables, even those not directly in the search area/buffer.
Note 2: The data tables in the report include information on relevant GIS layers that intersect with the search area/buffer area chosen.
Note 3: Currently, printing functionality has not been fully optimised. We recommend for the moment, that reports only be reviewed on-screen rather than being printed out.
Note 4: It is not the intention for this tool to replace the requirement for Planning Authorities to carry out their own SEA Scoping or Screening assessments. It serves more as a resource in this regard.
To access this, go to the tools tab and select the Strategic Environmental Assessment option.
![]()
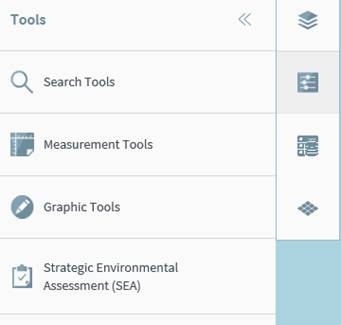
Figure 76: Accessing the SEA Tool
An input box will be shown in the top right corner of the screen. There are two pre-defined options to choose from: “Local Authority or “Settlement” under the Select Area tab. Select the relevant option from the drop-down list.
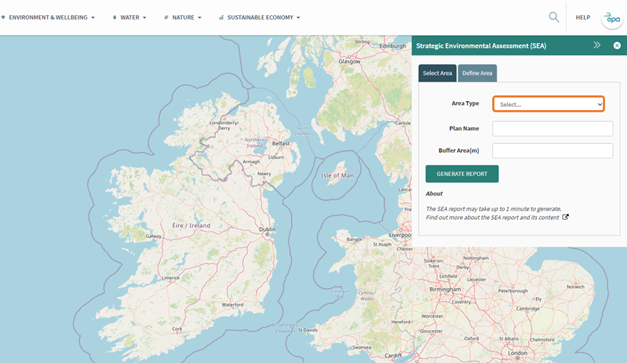
Figure 77: SEA Tool
Select “Local Authority” from the Area Type dropdown. This will display the Local Authorities layer on the map.
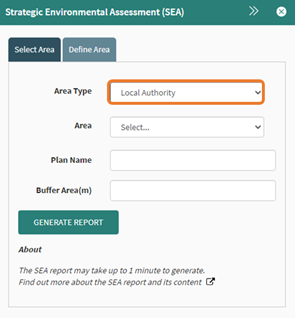
Figure 78: Area Type dropdown
Select the relevant Local Authority from the Area dropdown. This should isolate the Local Authority on the map layer.
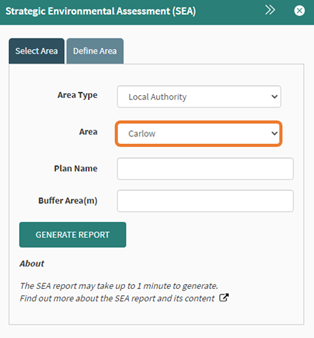
Figure 79: Area dropdown
A plan name is required, this is how the document is saved and will appear on the report that is created. The buffer can be set to add an additional area around the Local Authority selected. In this example a 200-meter buffer was applied.
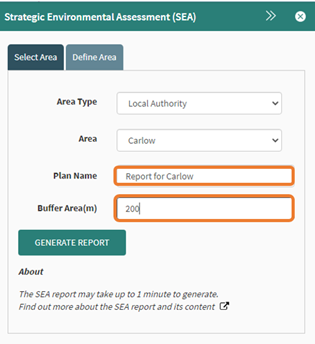
Figure 80: Enter report name and buffer
The generate report button will create the report and may take 60-90 seconds to complete depending on the size of area chosen.
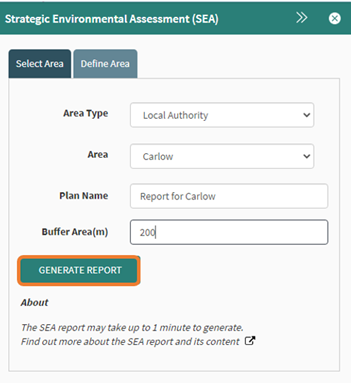
Figure 81: Generate report
The document will be downloaded and will appear in your browser. This is an example in Internet Explorer, but other browsers may display it differently.
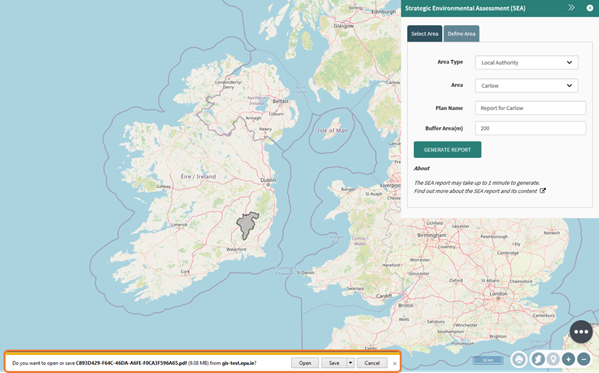
Figure 82: Download Report
Select “Settlements” from the Area Type dropdown. This will display the Settlements layer on the map.
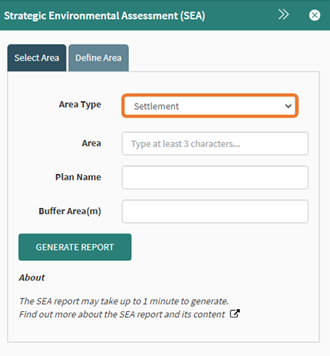
Figure 83: Settlements option
Typing at least three letters of the name of the settlement will begin the search to find the required settlement, if available. Click on the settlement of interest.
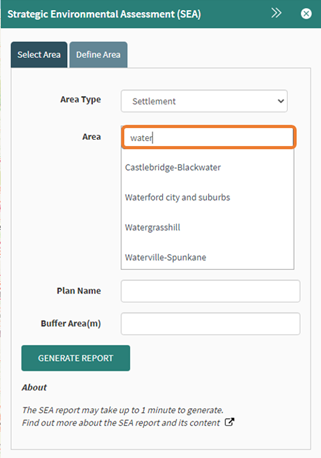
Figure 84: Settlement Area
A plan name is required, this is how the document is saved and will appear on the report that is created. The buffer can be set to add an additional area around the Settlement selected. In this example a 200-meter buffer was applied.
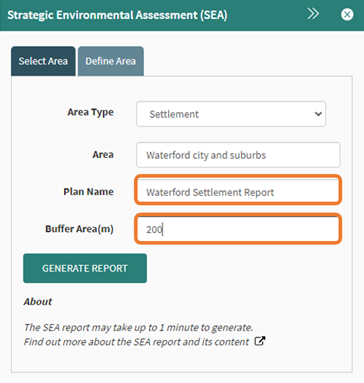
Figure 8547: Report name and buffer
The generate report button will create the report and may take 60-90 seconds to complete depending on the size of area chosen.
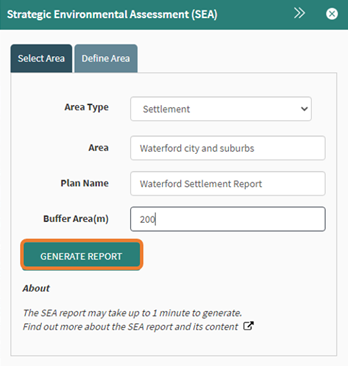
Figure 86: Generate report
The document will be downloaded and will appear in your browser. This is an example in Internet Explorer, but other browsers may display it differently.
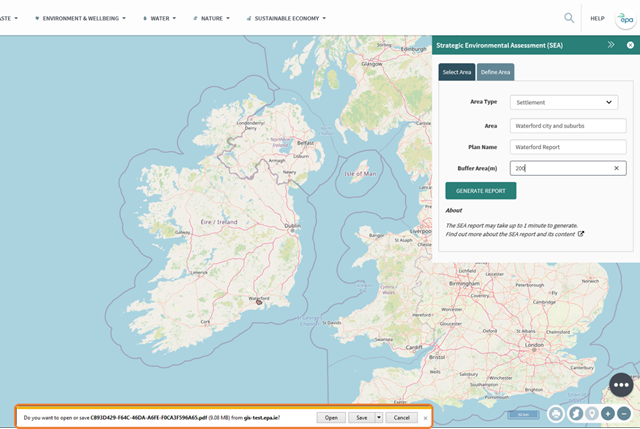
Figure 87: Download report
The define area function works in a similar way to the select area but in this option, it is possible to draw the specific area required.
Select the Define Area tab in the SEA Tool window.
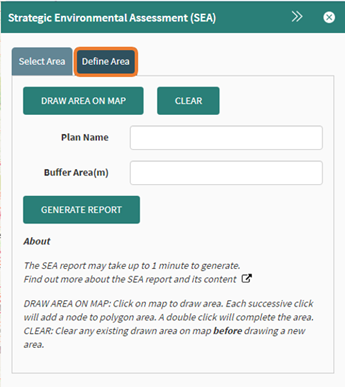
Figure 88: Define Area option
Select the draw area on map button.
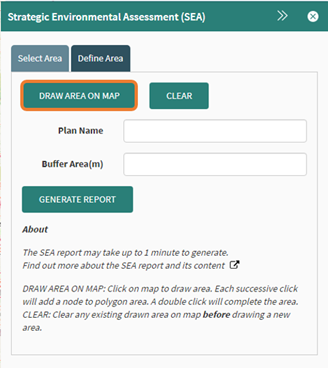
Figure 89: Draw area on map tool
It is then possible to click multiple
points upon the map to select the required area and use a double click to
finish the drawing.
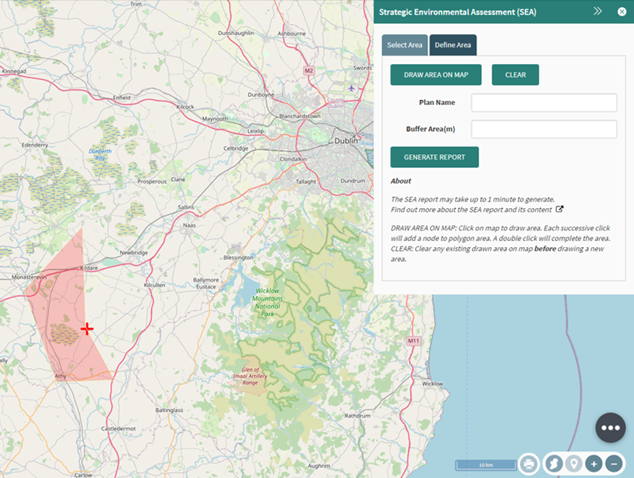
Figure
90: Area drawn on map
The clear button will remove any previous
attempt and drawing an area and a new selection can be made. It is important to click on the clear
button before drawing a new selection.
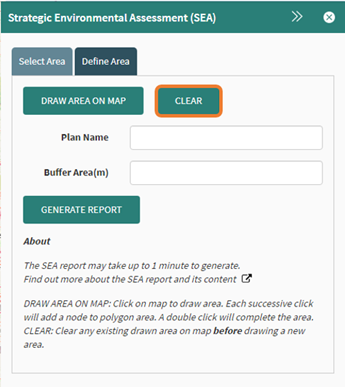
Figure
91: Clear selection
A plan name is required, this is how the document is saved and will appear on the report that is created. The buffer can be set to add an additional area around the drawn area. In this example a 200-meter buffer was applied.
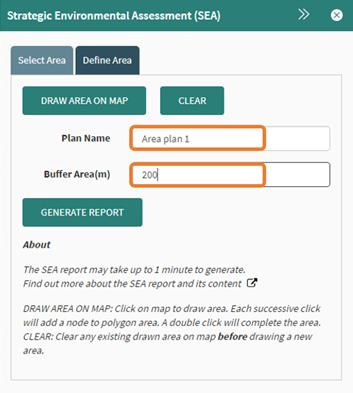
Figure 92: Report name and buffer
The generate report button will create the report and may take 60 to 90 seconds to complete depending on the size of area created. The document will be downloaded and will appear in your browser. This is an example in Internet Explorer but other browsers will display it differently.
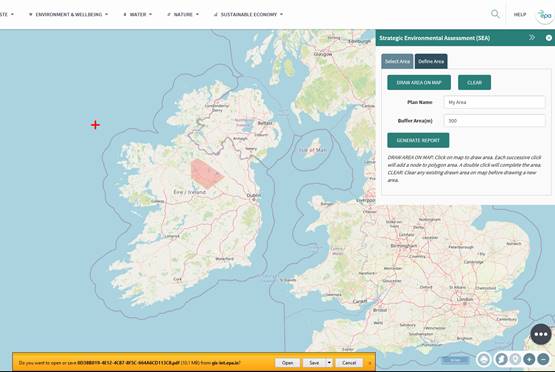
Figure 93: Export report
The first page of the PDF has a map with the Local Authority/Settlement/Area you selected and the buffer that has been applied along with the date it was generated and the plan name it was given.
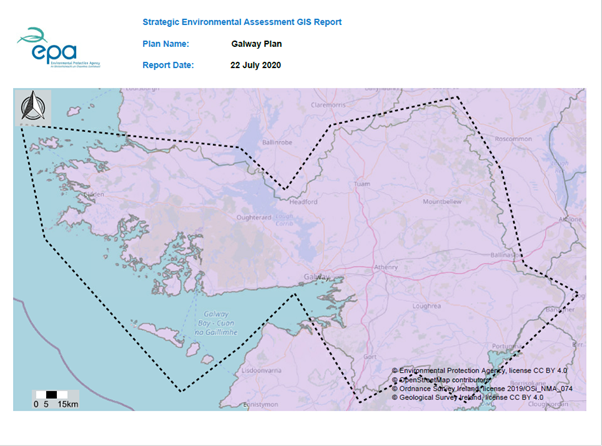
Figure 94: Example of report
The report follows
a structure similar to the below:
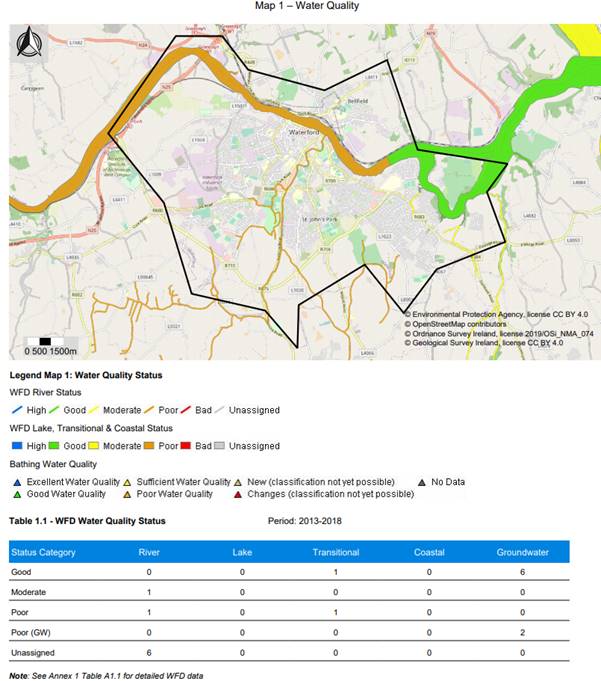
Figure 95: Example of map and tables in report
The report also
includes the following maps;
· Map 1 – Water Quality
· Map 2 – Water Quality: WFD Significant Pressures
· Map 3 – Conservation Areas
· Map 4 – Groundwater Vulnerability
· Map 5 – GSI Bedrock (1:1000000)
· Map 6 – Sand & Gravel Aquifer
· Map 7 – Landcover
· Map 8 – Landcover change
· Map 9 – Radon Levels
And the following tables;
· Table 1.1 WFD Water Quality Status
· Table 1.2 WFD Bathing Waters Quality
· Table 2.1 Water Quality: WFD Significant Pressures (EPA Licensed Facilities)
· Table 3.1 WFD Register of Protected Areas
· Table 3.2 Conservation Areas
· Table A1.1 – Detailed WFD Water Q
· Table A1.2 – Detailed Water Quality WFD Significant Pressures
· Table A2.1 – Detailed Water Catchment Data
Should you have any queries regarding the
functionality in this document or within the application, please contact the
GIS Team for support: http://gis.epa.ie/ContactUs